State Aid To Municipalities: Understanding Where We've Been and Where We're Heading
The information contained in this article is not intended as legal advice and may no longer be accurate due to changes in the law. Consult NHMA's legal services or your municipal attorney.
The following is an excerpt from NHMA’s recently updated publication State Aid to Municipalities: History and Trends. To read to entire publication, which includes additional information and graphs, please visit the NHMA website at www.NHMunicipal.org.
Understanding the various types of aid provided by the State of New Hampshire to municipalities is critical to understanding the effect that state-level budgetary decisions have on local property taxes. With the property tax as the primary source of local revenue, reductions in any state aid program, or the shifting of state costs to municipalities, most often results in increased property taxes. This article explains the state aid programs relied upon by cities and towns as well as recent trends in funding those programs.
While a major category of state aid is educational funding to school districts, that money goes directly to school districts, not to cities or towns, except in the nine cities where the school district operates as a department of the city. Education funding received by school districts affects the local school property tax rate, not the municipal property tax rate, and is not the focus of this article.
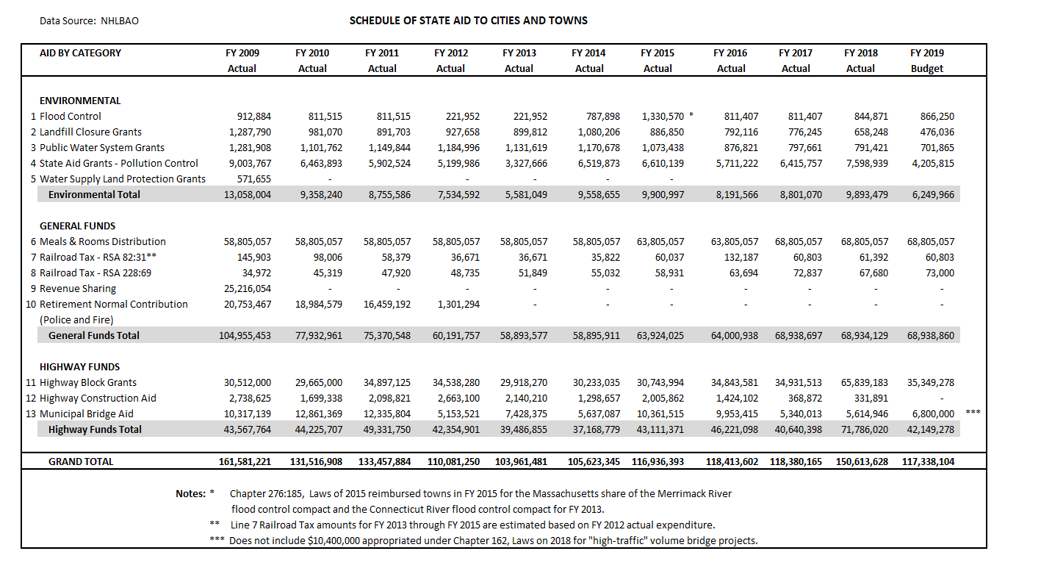
The state aid schedule (Chart A) prepared by the New Hampshire Legislative Budget Assistant’s Office (NHLBAO) shows the three major categories of state aid to cities and towns:
Environmental
Flood Control
Landfill Closure Grants
Public Water System Grants (Moratorium since 2008)
Pollution Control Grants
Water Supply Land Protection Grants
General Funds
Meals and Rooms Distribution
State Revenue Sharing (Suspended 2010-2019)
State Retirement Normal Contribution (Repealed 2013)
Railroad Tax (RSA 82:31 and RSA 228:69)
Highway Funds
Highway Block Grants
Highway Construction Aid
Municipal Bridge Aid
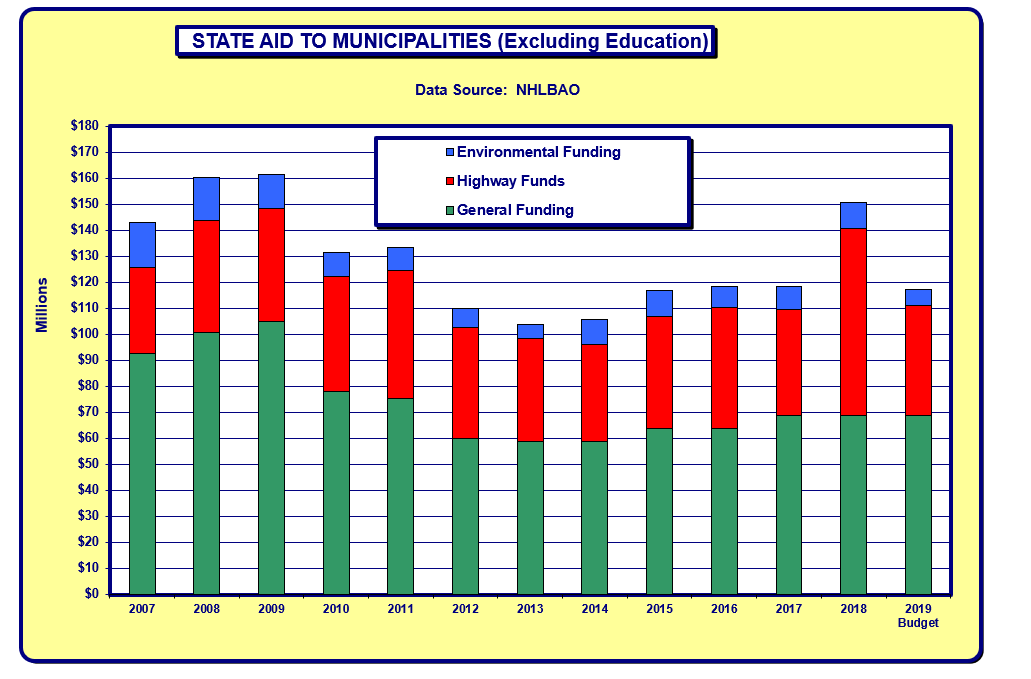
As illustrated in Graph B, state aid to municipalities significantly decreased in 2010-2014 as the state struggled to balance its own budget following the 2008-2009 recession. The use of one-time revenues or surplus funds accounts for the increase in 2018.
Meals and Rooms Tax Distribution
History. When the meals and rooms tax was first enacted in 1967, the intent was to share the revenue with municipalities, with the state retaining 60% of the revenues generated from the tax and municipalities receiving 40%. The legislature decreased the municipal share several times (in 1977 and 1981) virtually freezing the funding below the 1976 level. It was not until 1993 that the meals and rooms tax statute was amended to provide a catch-up formula to reach the statutorily intended 60/40 split. The formula provided that 75% of the year-over-year increase in revenue from the meals and rooms tax, but not more than $5 million in any one year, would be added to the previous year’s municipal distribution. The municipal share is distributed to cities and towns based on annual population estimates provided by the New Hampshire Office of Strategic Initiatives.
Trends. In 2001, the state/municipal share was 82%/18%. As the meals and rooms tax revenues gradually increased, so did the municipal share of those revenues due to the catch-up formula described above. In 2010 the state/municipal apportionment reached 71%/29%, which was based on the actual tax revenues received in the prior state fiscal year. However, the catchup formula was suspended from fiscal years 2010 through 2014, 2016, 2018 and 2019 while revenue from the tax continued to increase often well in excess of the prior year. As a result, the municipal share dropped from the high of 29% in fiscal year 2010 to 21% in fiscal year 2019.
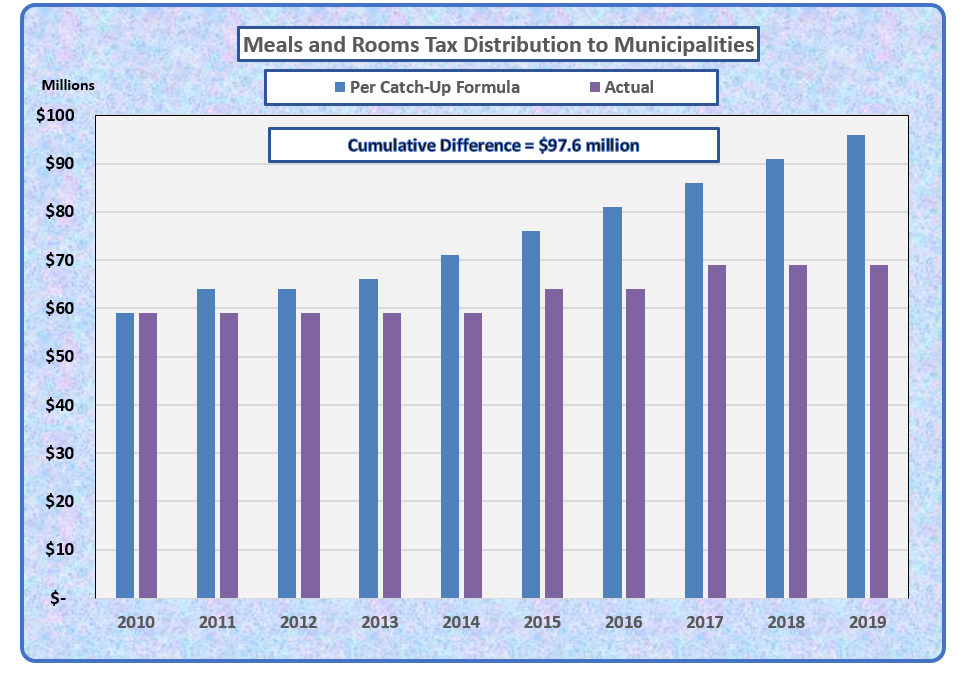
Since 2010, the meals and rooms tax revenues grew by 58% from approximately $204 million to just over $322 million (an unaudited figure at the time of this publication). During this same period, the municipal share increased by only 24% due to the suspension of the catch-up formula for eight of the past ten years. Had the catch-up formula continued rather than being suspended for eight years, the December 2018 (state fiscal year 2019) distribution to cities and towns would have been approximately $96 million, or 30% of the meals and rooms tax revenues received the prior year, rather than $68.8 million (21%). Cumulatively, the suspension of the catch-up formula has resulted in a loss to municipalities of approximately $98 million from state fiscal years 2010-2019 (Graph C).
Revenue Sharing
History. In 1969, reform of the way in which the state taxed businesses led to the implementation of the Business Profits Tax (BPT). This necessitated the elimination of antiquated taxes which were more reflective of an agricultural economy of the past. These taxes were assessed and collected by municipalities and were part of the property tax base for municipalities, school districts and counties. The initial intent of the revenue sharing statute, RSA 31-A, was to “return a certain portion of the general revenues of the state to the cities and towns for their unrestricted use”. Chapter 5, Laws of 1970.
On March 31, 1970, in testimony on House Bill 1, then New Hampshire Attorney General Warren Rudman responded to concerns that future legislators may choose not to honor this commitment to municipalities to fund revenue sharing, stating: … It seems quite doubtful to me that once this bill is passed that any legislator would go back on its pledge to return revenue to cities and towns that originally belonged to those cities and towns. And I might also add, in passing, that I could hardly see a Governor signing a bill which would deprive cities and towns of the revenue which they once had.”
Trends. Total revenue sharing in 1999 was $47 million. In 2000, as part of the statutory changes made to fund the state’s adequate education obligations, $22 million of revenue sharing that had been allocated to school districts became part of the adequate education aid funding. This left the balance of $25 million annually as general revenue sharing for municipalities and counties, which remained constant through fiscal year 2009. Since 2010, revenue sharing has been suspended resulting in a loss to municipalities and counties of $25 million per year, or $250 million cumulatively from fiscal year 2010-2019. The impact of this loss varies among municipalities, with deferred maintenance, use of reserves or fund balance, budget reductions and/or property tax increases among the common reactions to the loss of revenue sharing funds from the state.
Highway Block Grants
History. Twelve percent (12%) of the total road toll (gas tax) revenue and state motor vehicle fees collected in the preceding state fiscal year are distributed to municipalities through a local highway aid formula. This money comes from the state highway fund, not the state general fund, and provides funding to maintain and improve Class IV and Class V municipal roads and highways. Supplemental funds totaling $400,000 are distributed pursuant to a statute that provides additional funds to those municipalities with higher local roadway mileages and lower property valuations.
Trends. From fiscal years 2006 through 2010 the total amount of annual highway block grants varied from $28.5 to $30.5 million. In 2009 the legislature enacted a temporary 2-year state motor vehicle registration fee surcharge which increased both the amount of revenue in the state highway fund as well as the 12% share to municipalities in fiscal years 2011 and 2012, resulting in approximately $5 million more each year. This highly unpopular surcharge was repealed and block grant funding to municipalities returned to approximately $30 million per year from 2013 through 2015.
In 2014 the legislature raised the road toll for the first time in 23 years, increasing the rate by approximately 4 cents from 18 to 22 cents per gallon of gasoline effective July 1, 2014. This increase raised an additional $33 million per year in highway funding of which 12%, or an additional $4 million per year went to municipalities.
Following a principle of “using onetime revenue for one-time expenses”, in 2017 the state appropriated an additional $30 million for municipal highways from anticipated general fund surplus from the biennium ending June 30, 2017. This money was in addition to the annual highway block grants funded from the state highway fund, was apportioned to municipalities based on the same formula as highway block grants and was available for the same municipal highway purposes as the block grants. This additional funding is reflected in fiscal year 2018 and accounts for the significant increase that year in highway funding.
State Bridge Aid
History. The State Bridge Aid program under RSA 234 provides that funding for construction or reconstruction of municipally owned bridges shall be borne 80% by the state and 20% by the municipality, subject to the available level of funding each year. In 2015, 338 (20%) of the municipally-owned bridges were classified as “red listed” meaning the bridge was in poor condition, critically deficient and/or functionally obsolete. In 2017 under Senate Bill 38, the definition of red list bridges was modified. Previously the red list also included bridges with posted weight limits regardless of condition. This statutory change resulted in the removal of 71 bridges from the Municipal Red List. As of December 30, 2017, there were 252 municipal red list bridges out of 1,688.
Trends. Historically, State Bridge Aid had been budgeted at approximately $6.8 million annually which resulted in about a 10-year waiting list for state aid. Part of the revenue from the 2014 increase in the road toll discussed above was intended to double the amount of funding appropriated for municipal bridge aid, helping to reduce the 10-year waiting period to a more reasonable timeframe. However, this funding increase was short-lived with the fiscal year 2016-2017 budget appropriations dropping back down to the historic level of $6.8 million per year – with all of the appropriation coming from the 4-cent road toll increase, which was supposed to supplement, not supplant, the bridge aid provided through the highway fund.
An additional $2.5 million was provided in municipal bridge aid for fiscal year 2017 which came from surplus funds in the Department of Transportation’s winter maintenance budget due to the mild winter. For 2018, an additional $6.8 million was appropriated for municipal bridge aid, coming from the anticipated June 2017 state general fund surplus similar to the additional highway block grant funding explained above. For 2019 an additional $10.4 million was appropriated for municipally-owned “high traffic volume” bridge projects. This influx of additional state funding for municipal bridges over the past several years has helped to reduce the waiting period for all municipalities on the list for state bridge aid.
Environmental Grants
History. Municipalities received grants from the NH Department of Environmental Services for the construction, improvement and expansion of municipal wastewater and public drinking water facilities, and also for assistance with the cost of landfill closures. Under these programs, municipalities finance the full cost of the project up-front, complete construction and then apply for payment of the state share, which is 20% to 30% of the eligible project costs, usually paid by the state over the amortization period of the municipal financing (bonding or borrowing from the state revolving loan fund).
In 2016 the state created the NH Drinking Water and Groundwater Trust Fund to provide for the protection, preservation and enhancement of the drinking water and groundwater resources of the state. This trust was initially funded with $276 million from a 2016 lawsuit against Exxon- Mobil involving the gasoline additive MtBE. Authorized expenditures from the trust include competitive cost sharing grants and low interest loans to municipalities and municipally-owned water utilities, with administration of the trust fund vested in an eighteen-member commission comprised of state and local officials, as well as business and public members.
Trends. The amount of the environmental grants from the state general fund began declining in 2008 with funding in 2013 less than 32% of the funding in 2005 ($5.6 million vs. $17.6 million). As part of the 2010- 2013 budget reductions, the state only funded its obligations for grants approved through 2008. This left municipalities to pick up the anticipated state share ($53 million) for 127 previously approved and completed infrastructure projects - projects which were “sold” to property taxpayers based on financial commitments from the state. As part of the fiscal year 2014/2015 biennial budget, funding was restored for all projects. However, a moratorium was placed on funding any new environmental infrastructure projects that did not have local financing authorization by December 31, 2008. As of 2018, there were nearly 70 wastewater projects that would qualify for state aid of $93 million over the next twenty years if the moratorium is lifted.
While this future state funding for wastewater projects remains uncertain, funding for drinking water projects appears available. The NH Drinking Water and Groundwater Trust Fund Commission awarded $34.7 million in grants and loans for 21 projects in 2017, and $24 million for 19 projects in 2018. Since a significant portion of these awards were for low interest loans that will be paid back into the trust fund over time, it is planned that trust fund assets will be available to fund similar projects for at least the next two decades.
New Hampshire Retirement System
History. The New Hampshire Retirement System (NHRS) was established in 1967 to consolidate and replace four separate pension plan systems. NHRS is a public employee retirement system that administers one cost-sharing, multiple-employer pension plan providing a defined benefit annuity based upon a statutory formula, disability, and survivor benefits, for all full-time state employees, public school teachers and administration, permanent police officers, and permanent firefighters. Full-time employees of political subdivision (county, municipal or school district employees) are also eligible to become members of the NHRS if the local governing body elects to participate, which most have. NHRS also administers cost-sharing multiple employer healthcare plans, known as Other Post-Employment Benefit (OPEB) plans, which provide a medical insurance subsidy to qualified retired members. As of June 30, 2017, there were 47,886 active members of the NHRS and 35,694 retired members (including beneficiaries).
Trends. Funding for the NHRS comes from three sources: investment earnings, employee contributions, and employer contributions. Investment earnings fluctuate from year to year, with annual returns in the past 20 years reaching as high as 23% and as low as -18%. Over the long term, investment earnings provide anywhere from two thirds to three quarters of the funds needed to pay for pension benefits. For projection purposes, an “assumed rate” of investment return is adopted by the NHRS Board of Trustees. This assumed rate had been as high as 9.5% but was gradually lowered to the current rate of 7.25% for use in projecting future investment earnings. Lowering the assumed rate of future investment earnings results in higher employer contributions as explained below.
Employee and Employer Contribution Rates. The employee contribution rates are set by statute and are currently 7% for employees and teachers (Group I), and 11.55% for police and 11.8% for firefighters (Group II) effective July 1, 2011.
While employee rates are set by statute and have changed only once in the past 20 years, employer rates are adjusted every two years based upon an actuarial valuation to ensure adequate funding for future pension liabilities. Through these biennial rate adjustments, employers not only contribute toward their current employees’ retirement, but also bear the full financial burden of any funding shortfalls in the system, whether those shortfalls are the result of poor investment returns, insufficient funding in the past,
losses from actuarial assumptions regarding member demographics (such as when employees will retire, their age at retirement, how long they will live after retirement, and their earnable compensation), or increases in liabilities from statutory changes to the plan design. Lowering the assumed rate of future investment returns has a direct impact on future employer rates since it is the employer rates that fluctuate biennially to insure the system is adequately funded.
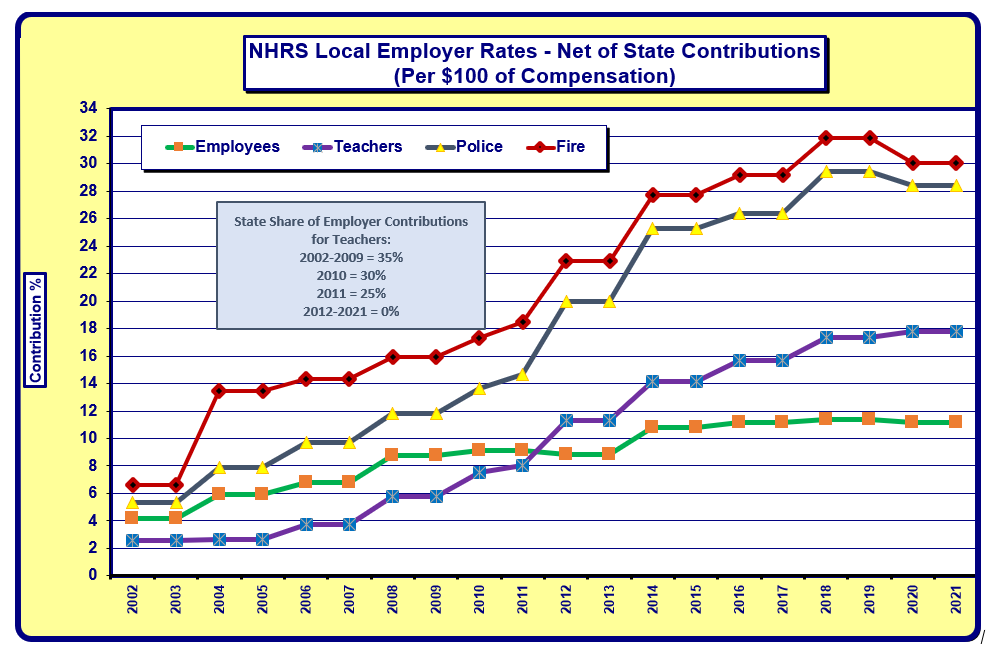
State Contribution for Teachers, Police and Firefighters. The State of New Hampshire had funded a portion of the normal retirement costs for teachers, police and firefighters, a practice that dated back to 1940 under the predecessor retirement systems. Since 1977, the state contribution had been set by statute at 35% of the cost, with municipalities, counties and school districts paying 65% of the cost for teachers, police and firefighters. (Municipalities, counties and schools paid 100% of the cost for all other employees enrolled in the NHRS.)
The state contribution rate was lowered to 30% in 2010, to 25% in 2011, to $3.5 million in 2012 and then eliminated in 2013. This resulted in local governments paying 100% of the retirement costs for teachers, police and firefighters in 2013 and beyond. Graph D illustrates the local government employer contribution rates for every $100 of compensation from 2002 through 2021. The significant increases in the rates from 2010 to 2015 are primarily the result of elimination of the state contribution, reductions in the assumed rate of return, and investment losses from the 2008- 2009 recession.
As the Governor and Legislature begin creating the state budget for the fiscal year 2020-2021 biennium, municipal officials are urged to talk with their respective Representatives and Senators about the importance of funding these state aid programs and the impact it has had on municipal operations and local property taxes.
Barbara T. Reid is the Government Finance Advisor for the New Hampshire Municipal Association. She can be reached by telephone at 603.230.3308 or by email at breid@nhmunicipal.org.
Chart A